|

Tidbits about Inequality
Graphing
|
Can I shade just the answer without
the overlaps? |
|
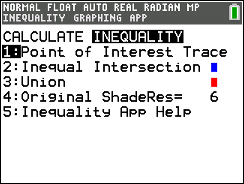
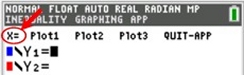
After you engage the Inequalz APP, take a look at 2nd CALC.
You will see that a new entry has been loaded at the top, called INEQUALITY. Arrow over to that new item and you will see a new listing. These extended options will allow us to narrow in on just the overlapping solution.
Demo: Solve 
The first graph shows the inequalities before the extended option are used.
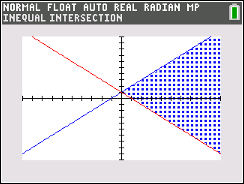
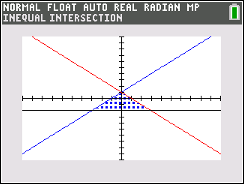
Let's apply the new extended option 2 on intersection.
• Be sure your inequalities have been entered into the APP and appear listed with inequality symbols.
• Go to 2nd CALC and arrow over to INEQUALITY.
• Choose option 2. Inequal Intersection.
•
ENTER
WOW! Nice feature! |
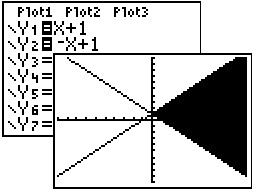
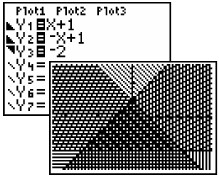
Graph without extended option.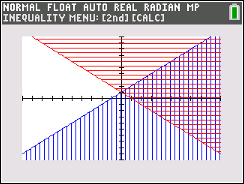
INEQUALITY
Intersection
option:
 |
Can I shade just the answer without
the overlaps? |
You can shade the area between two graphs. The Shade command shades the area that
is specifically above the lower function and below the upper
function.
Only the areas where lowerfunc < upperfunc are shaded. Shade (lowerfunc, upperfunc) |
Demo: Solve
|
| |
- Enter Y1 = x + 1 and Y2 = -x + 1
- Graph
to determine which graph is the "upperfunc". In this problem it
is Y1. Think of the "upperfunc"
as "function
to shade below". (Be careful not to confuse the "upper"
function with the "greater than" symbol.)
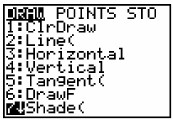
- Press DRAW (2nd
PRGM) and choose option #7
Shade(
- Type Shade(Y2,
Y1)
|
 |
| |
The Shade parameters are:
Shade(function to shade above, function to
shade below)
Additional
parameters allow:
Shade(function to
shade above, function to shade below, left bound, right bound,
the pattern (a number from 1 to 4), pattern resolution (a number
from 1 to 8))
|
 |

|
Can I make
it shade ONLY between three lines? |
|
|
After you engage the Inequalz APP, take a look at 2nd CALC.
You will see that a new entry has been loaded at the top, called INEQUALITY. Arrow over to that new item and you will see a new listing.
Demo:
Solve 
We saw this example graphed under Graphing Inequalities and it looked like the image "Previous Graph" on the right.
Using that graph, we would need to look carefully to determine where the final intersection occurred.
With this new INEQUALITY option, where the answer is located will be crystal clear, since only the answer will be shaded.
• Be sure your inequalities have been entered into the APP and appear listed with inequality symbols.
• Go to 2nd CALC and arrow over to INEQUALITY.
• Choose option 2. Inequal Intersection.
•
ENTER
|
Previous Graph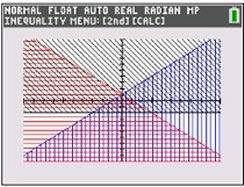
Graph Using
INEQUALITY option:
 |
Can I make
it shade ONLY between three lines? |
You have to be rather creative
to get the calculator to shade only between three lines, but it can be done.
In most cases, it will be more work than worth. Unfortunately, the Inequalz APP on this older TI-84 Plus model, does not have the extended INEQUALITY (2nd CALC) option that the
TI-84 Plus CE offers.
Demo:
Solve
|
| Method 1: (All
shaded) Enter the
inequalities into Y1,
Y2 and Y3 and choose the proper "shade
above" or "shade below"
built-in icons in front of the Y=. As you can see at the right, all
areas are shaded and the answer is the darkest
shading. |
 |
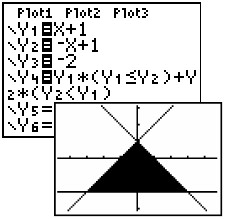
| Method 2:
(Answer only, shaded)
Enter
the inequalities without the built-in "shade
above/below" icons. This method will use the
Boolean operators.
Look carefully at the Y3 entry.
If the statement is true, a value of 1 is being
multiplied times the function, and if false a value
of 0. The * (for multiplication) is
needed so that the function is not calculated as a
composition of functions.
Then Shade
(Y3, Y4) to get the
solid figure. Whew! |
Shade
(Y3, Y4) to see graph. |
|
|
What about shading left or
right of a vertical line? |
|
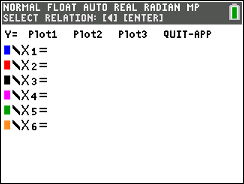
We will be using the Inequalz APP for vertical lines. Remember we saw that "x =" had been added to the new APP inequality screen?
Time to put it to use.
When you arrow up and activate "X=". the screen changes from "Y=" to X=", allowing for vertical lines.
Demo: Graph the
solution set to this system of
inequalities:
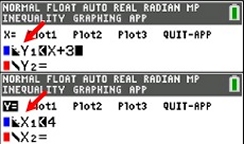
- Activate the Inequalz APP.
- Enter the inequality y < x + 3.
- Enter the inequality x < 4 using the "X=" option.
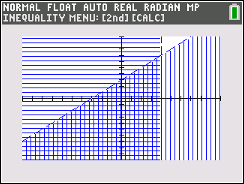
- Hit GRAPH and you will see both relation inequalities shaded.
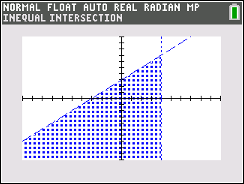
- To see only the answer shaded, activate (2nd CALC), INEQUALITIES, #2, Inequalz Intersection
And simply hit ENTER.
|
|
For the TI-84 Plus CE - NOT in APP mode:
It is also possible to use the DRAW Shade Command to shade left or right of a vertical line.
• 2nd PRGM (Draw).
• #7 Shade(
• Enter, for this example of x < 4) Shade(-9999, 4, 1,1)
• Press ENTER.
Parameters are: Shade(lower-bound, upper-bound, pattern, color).
Use a BIG negative number (numeral wise) for the lower bound, in this case.
x > 4 would look like Shade(4, 9999, 1,1)
Use a BIG number for the upper bound in x > 4.
|
|
What about shading left or
right of a vertical line? |
You will need to engage the DRAW
commands to create vertical lines for shading.
|
Demo: Graph the
solution set to this system of
inequalities:

- Graph the first equation by entering into Y1 and choosing the
"shade below" built-in icon.
- Choose DRAW
(2nd PRGM) and #4 Vertical. When the
word Vertical appears on the
home screen, type in your desired x-value. In
this case, you should have:
Vertical 4
(this will draw the vertical line x = 4)
- Choose DRAW
(2nd PRGM) and #7 Shade.
Type: Shade( -10, 10,
-10, 4, 2, 3) and hit Enter. The Shade parameters
are:
-- the first two numbers are the range of y values you want
to see
-- the second two numbers are the range of x-values
-- the fifth number is the pattern set to horizontal
(default pattern is vertical)
-- and the last number 3 will plot every 3rd pixel.
- The answer is the overlapped shading.
|
 |

Finding
Your Way Around TABLE of CONTENTS
|